Dashboard
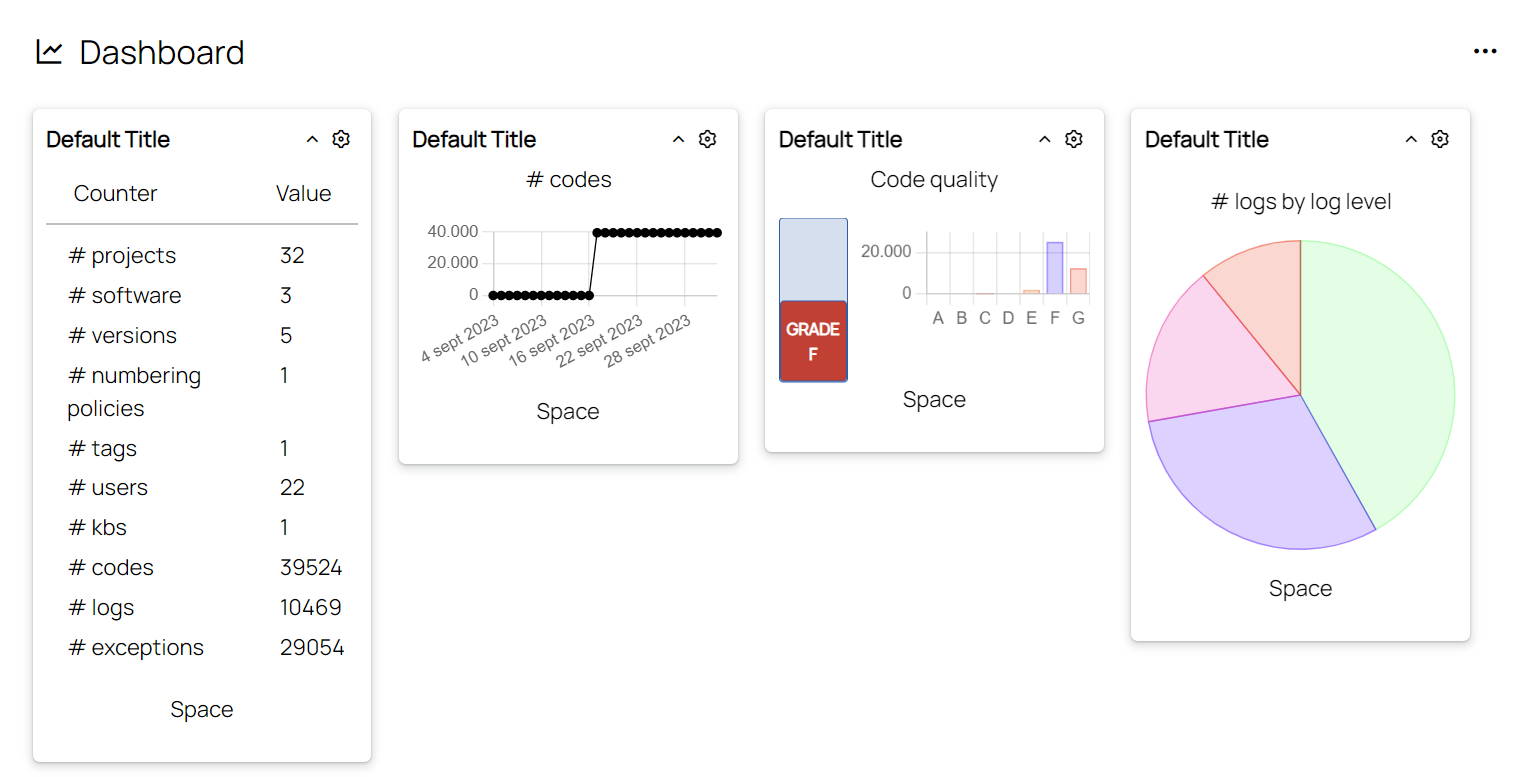
This is the place where you can create a customizable overview of the current state of your projects. It consists of a collection of widgets, each showing a different aspect. This is how a typical (default) dashboard looks like:

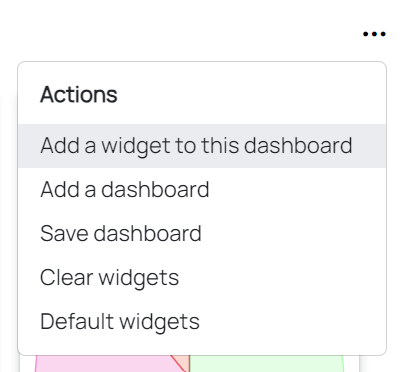
You can create dashboards, add widgets, clear them and even create several default ones in one go from the context menu located in the top right (…).

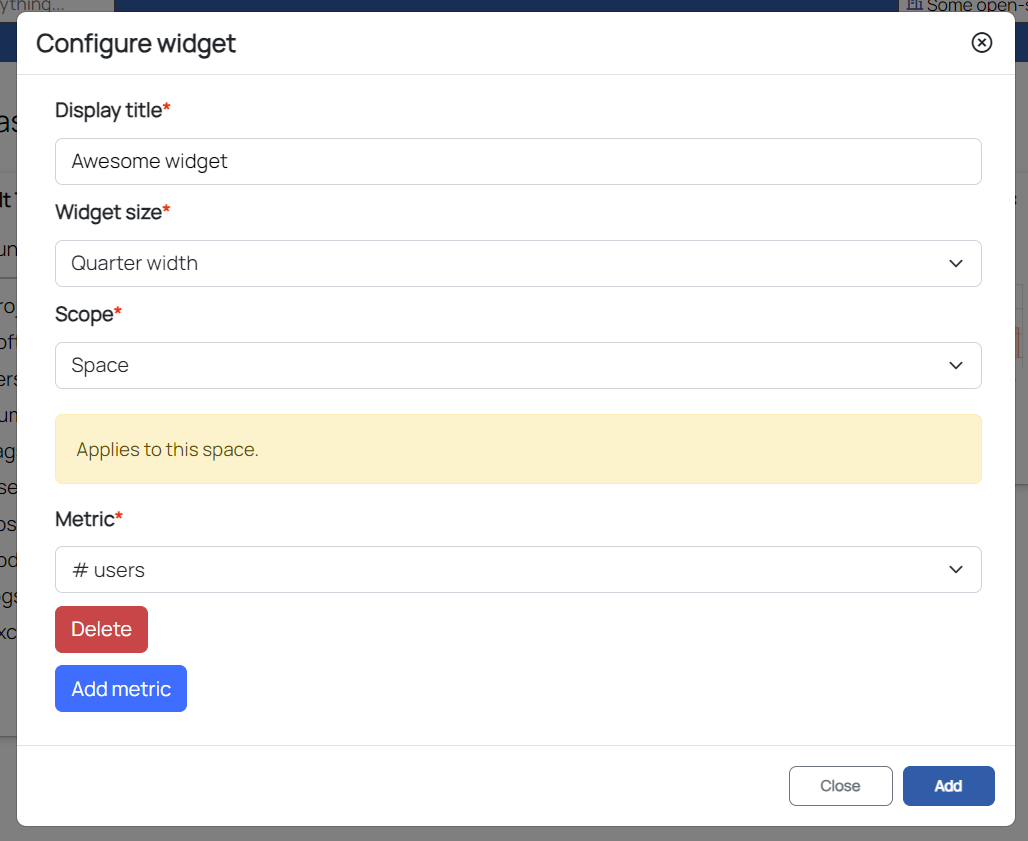
There are several widgets available, including counters, charts and code quality reports. You can even add a summary of your billing info. When adding a new widget, you must define a name for it and select a size and a scope. Depending on the widget type, you can then add one or more metrics. Some also have grouping and/or filtering capabilities.

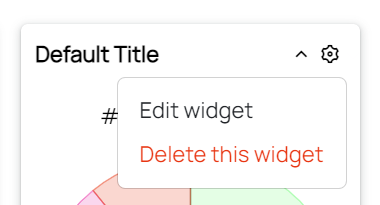
You can edit or delete a widget from its config menu, accesible via the cog icon in the top right corner. You can also collapse/expand it via the chevron icon next to it.
